Examples
Inputs
Chombo input files can be read and written using some utility functions
from chombopy.inputs import read_inputs, write_inputs

inputs = read_inputs('/path/to/inputs')

# inputs is a dictionary, with the key values converted to appropriate python objects:
print(inputs['main.num_cells']) # e.g. [16, 16, 16]
print(inputs['main.verbosity']) # e.g. 3
print(inputs['main.plt_prefix']) # e.g. 'plt'

# You can alter the values
inputs['main.verbosity'] = 0

# And write the file back out
write_inputs('/path/to/new_inputs', inputs)
Reading data and plotting
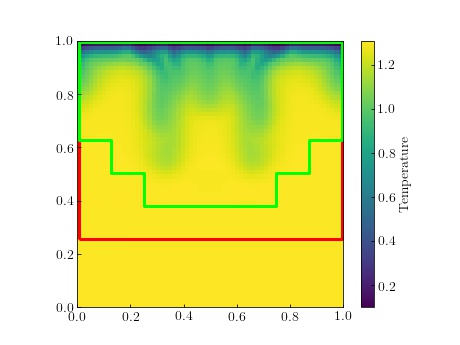
Chombo plot files can be read using the PltFile class. An example can be found in examples/example_plotting.py:
import matplotlib.pyplot as plt
from chombopy.plotting import PltFile, setup_mpl_latex
import matplotlib.cm as cm

pf = PltFile('../tests/data/plt000100.2d.hdf5')

setup_mpl_latex(14)
fig = plt.figure()
ax = plt.gca()
cmap = 'viridis'
field = 'Temperature'

# Get data for the temperature variable on level 2
for level in pf.get_levels():
    temperature = pf.get_level_data(field, level)

    # temperature is an xarray.DataSet object, which can be plotted using matplotlib
    x, y = pf.get_mesh_grid_for_level(level=level, grow=True)
    ax.pcolormesh(x, y, temperature, cmap=cmap)

    # Or you can do some analysis using the xarray/numpy functionality
    print(temperature.mean())


pf.plot_outlines(ax)

cbar = fig.colorbar(cm.ScalarMappable(norm=pf.get_norm(field), cmap=cmap), ax=ax)
cbar.ax.set_ylabel(field)

plt.savefig('plt000100.jpg')
plt.show()
Result: